Article
Startup survival needs operating dashboards
Startup formation is a hopeful signal, but it is not proof that a company is becoming durable. A new product, a first sales pipeline, a small funding round, and a busy founder calendar can all make a startup look alive while the survival mechanics remain weak.
That is the trap behind activity theater. Teams add campaigns, hire roles, ship features, and start AI pilots because each action feels like progress. Yet the question that matters is harsher: is the company learning how to survive without heroic effort?
The thesis is simple: startup survival needs operating dashboards. Not a vanity dashboard for investor updates. Not a generic KPI board with traffic, revenue, cash, and tasks. A survival dashboard is an internal operating product that shows whether demand is repeatable, retention is visible, funding dependency is shrinking, founder labor is becoming less critical, and AI readiness is strengthening the model rather than decorating it.
The warning is not theoretical. The GEM 2025/2026 Global Report says its latest findings are based on more than 160,000 responses across 53 economies, with record startup activity in many regions, but also a widening Survival Gap and AI Readiness Gap. The operational lesson for founders is direct: high formation can coexist with weak transition into established firms.
Formation is not survival
Early startup dashboards often reward motion. How many leads did we contact? How many features shipped? How many pilots opened? How many investors replied? Those numbers are useful, but they do not answer whether the company is becoming more repeatable.
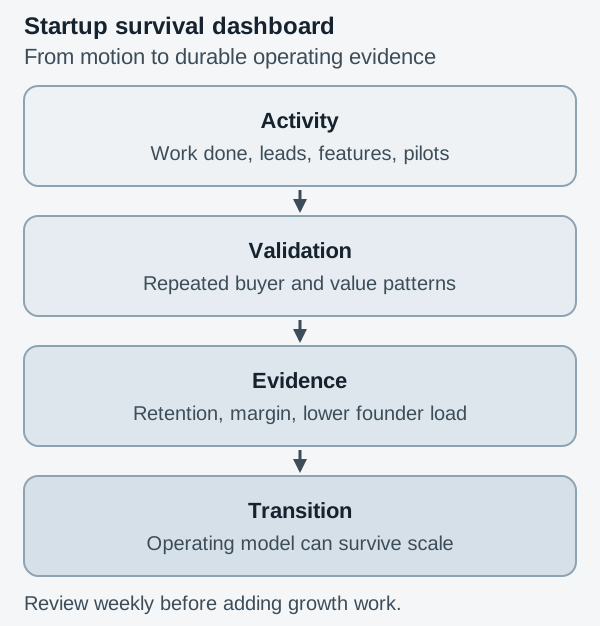
A survival dashboard starts by separating activity from evidence. Activity says, “we are doing the work.” Evidence says, “the work is producing a pattern we can rely on.” That distinction changes the conversation in a weekly review.
For example, ten demos in a week can be good activity. Survival evidence asks whether the same buyer type keeps appearing, whether the problem language is converging, whether conversion improves without founder improvisation, and whether customers return after the first success moment. A shipped feature can be good activity. Survival evidence asks whether it removes a blocker in the buying path, increases retention for a defined cohort, or reduces manual support load.
This is close to the logic of MVPs need atomic-unit tests: do not test the whole dream at once. Test the smallest unit that must be true for the business to stand. A survival dashboard extends that discipline from product validation to company operation.
What belongs in a survival dashboard?
A useful survival dashboard should be short enough to review every week and serious enough to cancel work. Five sections are usually enough.
First, repeatable demand. Track qualified demand by segment, source, problem, and buying trigger. The number is less important than pattern quality. If every sale requires a different pitch, a different promise, or a different manual workaround, demand is not yet repeatable.
Second, retention evidence. Do not stop at acquisition. Show whether customers, users, teams, or accounts come back after the first moment of value. Use cohorts where possible, even if they are small. If you cannot yet produce stable cohorts, write that limitation on the dashboard. Missing evidence is evidence too.
Third, funding dependency. Survival is not the same as profitability, especially in venture-backed contexts, but the team should know which parts of the operating model exist only because cash is being burned. Track runway, gross margin direction, payback assumptions, and the experiments expected to reduce dependency on external capital.
Fourth, founder labor. Many startups survive because the founder absorbs every exception: sales nuance, delivery rescue, customer success, product prioritization, recruiting, and investor narrative. The dashboard should show where founder labor is still the system. A company is not becoming durable if every important workflow collapses when the founder is unavailable.
Fifth, AI readiness. This does not mean adding a model to the product. It means knowing where AI can improve productivity, decision quality, support, analysis, or delivery, and where the company lacks data hygiene, workflow clarity, permissions, or evaluation discipline. AI readiness is an operating capability, not a slide in the roadmap.
Which metric should make the team stop?
The dashboard is only useful if it can say no. A survival dashboard without stop rules becomes another performance ritual.
Before the next growth initiative, define the red lines. If retention evidence is absent after a defined number of activated customers, stop acquisition spend and investigate value delivery. If founder-led sales keeps closing but non-founder sales cannot progress, stop hiring more closers and rewrite the sales system. If AI pilots create more review load than they remove, stop expanding automation and fix the workflow.
This connects directly to Product bets need kill criteria, not optimism. The founder version is even more uncomfortable because stopping a growth idea can feel like slowing momentum. In reality, it protects the company from confusing energy with durability.
The dashboard should include three kinds of thresholds: continue, investigate, and stop. Continue means the signal is strong enough to keep investing. Investigate means the signal is mixed and needs a focused learning sprint. Stop means the company has learned enough to avoid more spend, more complexity, or more founder exhaustion.
Use the dashboard to cut work
The best survival dashboard reduces the operating surface area. It should not create a new reporting burden for an already overloaded team. If it cannot help remove meetings, campaigns, features, or experiments, it is probably too decorative.
Start with one page. Put the five sections in rows: repeatable demand, retention evidence, funding dependency, founder labor, and AI readiness. For each row, write the current signal, the main risk, the next decision, and the owner. Avoid perfect instrumentation at the beginning. A manually updated dashboard is acceptable if it improves the decision cadence.
Then use it in a weekly survival review. The agenda is not “what happened?” The agenda is “what changed our survival odds?” That small wording shift matters. It moves the team away from status reporting and toward operating judgment.
A good dashboard also makes investor conversations sharper. Instead of presenting only growth activity, the founder can show where the company is reducing uncertainty: the segment that repeats, the cohort that returns, the workflow no longer dependent on the founder, the AI use case with a measured productivity gain, the funding risk being actively compressed.
This is why An operational dashboard is an internal product is not just a dashboard article. The dashboard has users, decisions, maintenance cost, and failure modes. If founders treat it as a product, they will ask whether it changes behavior. If it does not, they will redesign it.
Build it before the next growth initiative
Many startups do not need one more channel, feature, or automation pilot yet. They need a clearer view of whether the current machine can survive.
Build the survival dashboard before starting the next growth initiative. Keep it small. Make the weak signals visible. Put founder labor on the page. Treat AI readiness as operational capacity, not branding. Add stop rules before the team is emotionally committed to more work.
Startup activity is worth celebrating. But activity alone does not become a company. Survival becomes more likely when the team can see, week by week, whether the system is learning to stand without theater.