Article
Growth metrics need survival cohorts
Births are not growth
Most growth dashboards are biased toward birth announcements. New accounts, new workspaces, new companies, new trials, new subscribers, new pipeline, new logos. The chart rises, the meeting feels safe, and the team leaves with the comforting idea that demand is moving.
But a birth is only the first line in a lifecycle. It does not say whether the entity remained active, became useful, expanded, went quiet, returned, or died. When the dashboard stops at births, the organization starts managing applause instead of survival.
The better thesis is simple: growth metrics need survival cohorts, not headline births. A product team should report every growth signal as part of a ledger that follows a cohort over time. That ledger should show births, active entities, survivals, deaths, reactivations, and high-growth status. The point is not to copy public statistics into a SaaS dashboard. The point is to borrow their discipline.
Eurostat’s business demography framework is useful because it treats enterprises as lifecycle entities, not as one-time counts. Its metadata covers active enterprises, enterprise births, deaths, survivals and high-growth enterprises, with related employment variables that make the lifecycle visible over time (Eurostat business demography). Product operators can adapt the same logic to customers, accounts, stores, creators, suppliers, teams, integrations, or any other unit that a business claims is growing.
This also changes the role of the dashboard. As argued in An operational dashboard is an internal product, a dashboard should shape decisions, not decorate status meetings. A birth-only dashboard shapes the wrong decisions. It rewards acquisition even when activation is weak, hides churn until finance asks uncomfortable questions, and makes reactivation look like a marketing footnote instead of a survival signal.
What should a survival cohort ledger contain?
A survival cohort ledger starts with a clear unit. Pick one entity type and stay consistent: customer account, paid workspace, merchant, facility, marketplace seller, monthly active team, or project. Do not mix people, accounts and events in the same survival view unless the relationship is explicitly modeled.
Then record the cohort by birth period. If an account first became qualified in January, it belongs to the January birth cohort. If a workspace first reached paid status in week 12, it belongs to week 12. The birth definition must be written down, because every downstream rate depends on it.
After that, the ledger needs lifecycle states. A practical version has five columns.
First, births: entities newly created or newly qualified during the period. This is the familiar number, but it becomes only the opening balance.
Second, active survivors: entities from prior cohorts that remain active according to a stated rule. Activity should mean something operational, not just existence in a database. For a B2B product it might mean usage by at least two qualified users in the last 30 days. For a marketplace it might mean at least one completed transaction. For a content platform it might mean publishing and receiving qualified engagement.
Third, deaths: entities that crossed the inactivity or churn threshold. Death is an uncomfortable word, but euphemisms damage measurement. If the account stopped paying, if the seller has not transacted for the defined window, if the integration has not sent data for 90 days, the ledger should say so.
Fourth, reactivations: entities that were dead or dormant and became active again. Reactivation deserves its own line because it tells a different story from acquisition. A reactivated account may prove latent value, better onboarding, seasonal behavior, or a support intervention that worked.
Fifth, high-growth signals: entities whose activity, revenue, usage or contribution crossed a meaningful growth threshold. This column prevents survival analysis from becoming merely defensive. You are not only asking who stayed alive. You are asking which surviving cohorts compound.
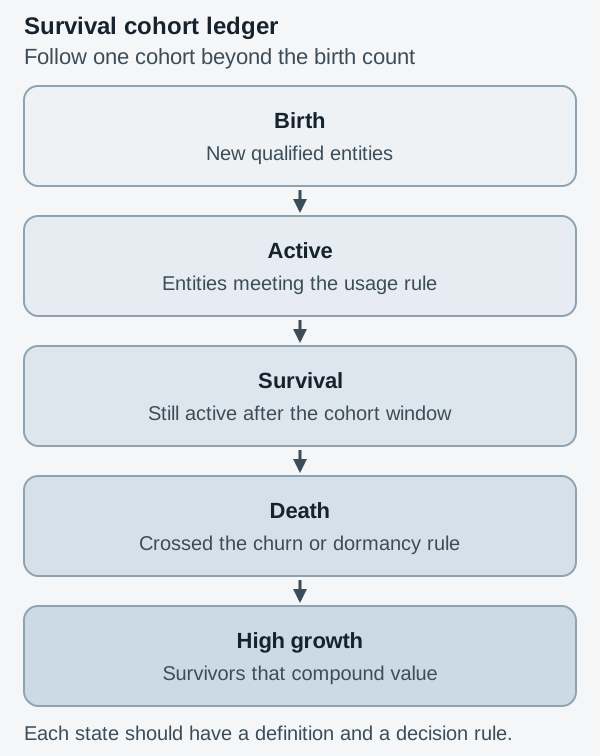
The ledger should be boring enough to maintain and sharp enough to guide decisions. If a metric cannot be assigned to one of these lifecycle states, it may still be useful, but it is not a growth health metric yet.
Deaths and reactivations are decision signals
The hardest cultural shift is to make deaths visible without turning the meeting into a blame ritual. Deaths are not a reason to punish acquisition, sales, onboarding or customer success by default. They are a reason to locate the lifecycle break.
A cohort with many births and early deaths points to qualification, promise or onboarding. The team may be attracting the wrong users, overselling the product, or failing to get the first useful action completed. This connects directly to the argument in Your trial is not broken: you are bringing in the wrong users: a leaky trial is often a targeting problem before it is a conversion problem.
A cohort with decent early survival and later deaths points somewhere else. Maybe the product works for the first job but not the recurring job. Maybe the first team succeeds but expansion stalls. Maybe usage depends on one champion, one integration, or one seasonal need. The dashboard should not answer all of those questions by itself. It should make the right investigation unavoidable.
Reactivations need the same seriousness. Many dashboards report them as part of active users, which makes the active line look healthier while hiding the mechanism. A reactivation is not the same as a retained survivor. It has a previous failure inside it. That failure may be acceptable, seasonal, or strategically useful, but it should be visible.
For example, a B2B analytics product may discover that a large share of reactivations happens after board reporting cycles. That would change messaging, lifecycle emails, sales follow-up and product packaging. A marketplace may find that seller reactivation follows inventory availability rather than promotional nudges. A team collaboration product may see reactivation after personnel changes, which suggests an admin and handover problem rather than a feature gap.
The ledger lets the team ask better questions: Which cohorts survive past the first meaningful value event? Which deaths are concentrated in one channel? Which reactivations happen without paid intervention? Which high-growth accounts were nearly dead before they expanded? These are operating questions, not vanity questions.
How do you turn this into a dashboard?
Start by replacing the single growth chart with a cohort table and three companion views.
The cohort table should show birth period down the rows and age across the columns. Month zero, month one, month two, month three, and so on. Each cell should show survival rate, active count, or contribution, depending on the decision the dashboard supports. If the executive question is business health, show surviving active entities and their contribution. If the product question is onboarding, show survival to first value. If the growth question is acquisition quality, segment cohorts by channel or promise.
The first companion view is a lifecycle waterfall for the current period: starting active entities, plus births, plus reactivations, minus deaths, ending active entities. This prevents the team from saying active accounts went up without explaining why.
The second companion view is a death register. It should group deaths by cause or observable pattern: never activated, no second use, payment failure, feature mismatch, seasonal dormancy, admin loss, integration break, migration, competitor, unknown. Unknown is allowed, but it should not become the largest stable category.
The third companion view is a high-growth cohort view. It should identify which surviving cohorts are compounding and where that compounding comes from. More seats, more transactions, higher order value, more automated workflows, more retained projects. This is where growth becomes quality, not only quantity.
Decision rules matter. In Measuring outcomes when the team still looks at hours, the central problem is that teams often measure what is easy instead of what proves movement. Survival cohorts force a better outcome conversation. The team can still inspect acquisition volume, but it cannot call the business healthy unless cohorts survive and valuable survivors expand.
Audit one dashboard this week
Take one growth dashboard and mark every metric with one label: birth, survival, death, reactivation, or high-growth. If the label is unclear, write unclear. If the dashboard has ten birth metrics and no death metric, the problem is not visualization. The problem is governance of attention.
Then choose one entity type and one cohort period. Define birth. Define active. Define death. Define reactivation. Define high-growth. Do not start with a perfect model. Start with definitions that the team can defend in a review.
Finally, add one decision next to each lifecycle state. Births should trigger acquisition quality questions. Survival should trigger activation and value questions. Deaths should trigger loss analysis. Reactivations should trigger lifecycle and timing questions. High-growth should trigger expansion and replication questions.
Growth reporting becomes useful when it stops celebrating the arrival of new entities and starts accounting for what happens to them. Births are news. Survival is evidence. A dashboard that can show the difference gives operators a better chance of building a business that lasts.