Article
Digital metrics need boundary registers
Digital transformation is often measured too late and too confidently. A team modernizes a channel, automates part of a workflow, adds AI support, moves a service into a product interface, then opens a dashboard and starts arguing about the line. Is digital revenue up? Are customers adopting the new journey? Is the operating model becoming more efficient?
The argument usually sounds analytical, but the real problem is earlier. The team has not written the boundary of the metric. It has not said what counts as digital activity, what is excluded, what proxy stands in for the thing it cannot observe, how delayed the signal is, or which decision the number is allowed to support.
That is why digital metrics need boundary registers. The register is not documentation after the dashboard. It is the measurement product before the dashboard. The OECD Digital Economy Outlook 2024 frames the broader need clearly: as digital transformation spreads through the economy, institutions need a stronger evidence base and more timely measurement of digitalisation, not just more indicators on a screen. OECD Digital Economy Outlook 2024
The metric is not the transformation
A dashboard can make a weak definition look official. Once a metric has a chart, color scale and target, it starts to feel self-evident. Digital share, digital adoption, automation rate, AI assisted resolution, self-service completion and online conversion all sound precise. In practice, each one hides boundary choices.
Take digital share. Does it include orders researched online but completed through sales? Does it include subscription renewals triggered by an account manager using a digital tool? Does it include assisted checkout when a support agent completes the flow on behalf of a customer? Does it count only web and app, or also API transactions, partner portals and embedded commerce?
None of these answers is naturally right. The wrong move is pretending the question does not exist. A product lead may want digital share to reflect customer behavior. A finance lead may want it to reflect recognized revenue channel. An operations lead may want it to reflect work removed from manual processes. Those are different metrics wearing the same name.
This is close to the problem in AI adoption metrics need denominator maps. Adoption is never only the numerator. Digital transformation is never only the count of digital events. The denominator, the eligible population and the excluded cases are part of the claim.
What belongs in a boundary register?
A boundary register is a compact record attached to a metric before it appears in a review. It should be boring enough to maintain and specific enough to stop false confidence.
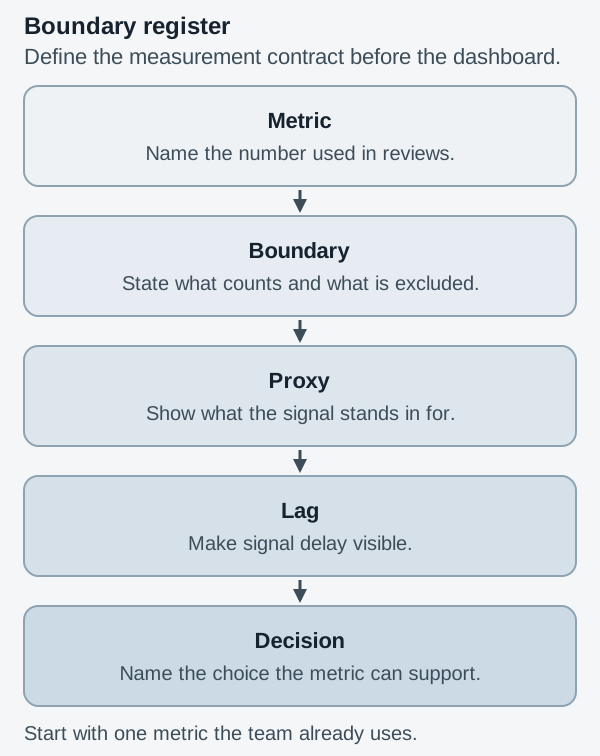
Start with the metric name. Use the name people actually use, not a technical event label. Then write the boundary. The boundary says what is inside the metric and what is outside. For digital service completion, the boundary might include authenticated customer journeys that end without human intervention, and exclude internal back-office processing that happens after submission.
Next write the proxy. Many digital transformation metrics are proxies because the real outcome is hard to observe. A click is not intent. A completed form is not value delivered. A chatbot containment event is not customer success. A feature usage event is not capability adoption. The proxy field forces the team to say what the number is standing in for.
Then write the lag. Some digital signals are immediate but shallow. Others are delayed but stronger. A dashboard may show same-day activation, but the business impact may appear in renewal, cost-to-serve, quality, risk reduction or customer effort weeks later. If the lag is not visible, teams overreact to fast signals and ignore slow consequences.
Finally write the decision. A metric that cannot name its decision is not ready for executive review. Will it decide whether to fund migration, reduce assisted support, change onboarding, sunset a legacy process, or keep a hybrid channel alive? A metric can inform several conversations, but it should have one primary decision it is designed to support.
Where do digital dashboards go wrong?
Digital dashboards go wrong when they turn boundary choices into hidden defaults. The data team knows that partner transactions are excluded. The product team assumes they are included. The growth team treats assisted conversions as digital success. The service team treats them as unresolved manual dependency. Everyone reads the same number and leaves with a different story.
This is why an operational dashboard is an internal product. It has users, jobs, trust conditions and failure modes. If the dashboard ships without a boundary register, the product ships without its operating instructions.
The most dangerous failure is not a visibly broken chart. It is a plausible chart with a weak proxy. For example, a company may report a rising self-service rate because more customers start in digital channels. But if unresolved customers later call support, the metric may have shifted work rather than removed it. The dashboard is not lying, but the boundary is too narrow for the decision being made.
Another common failure is mixing maturity levels. A team measures usage of digital tools, quality of digital experience, economic impact and operating autonomy in the same review. These are connected, but they are not interchangeable. Usage can rise while quality falls. Automation can rise while exception handling becomes more expensive. Digital revenue can grow while margin erodes because the channel depends on heavy manual recovery.
A boundary register prevents the dashboard from becoming a theater of precision. It says: this metric covers this slice, excludes these cases, uses this proxy, arrives with this delay, and should only be used for this kind of decision.
How should the register change decisions?
The register should change the meeting before it changes the chart. When a metric is presented, the first question should not be whether the line is up or down. The first question should be whether the metric is eligible for the decision on the table.
If the decision is whether to retire a call-center path, a digital completion metric that excludes repeat contacts is not enough. If the decision is whether to invest in AI support, a containment metric that ignores customer satisfaction and rework is not enough. If the decision is whether a transformation program is improving productivity, a count of automated steps is not enough.
This is the same discipline behind measurement systems needing score receipts. A score without a receipt asks the organization to trust the number without seeing how it was made. A digital metric without a boundary register asks the organization to trust a transformation claim without seeing what was left outside.
The register also makes disagreement productive. Instead of debating whether digital adoption is good or bad, leaders can debate whether assisted transactions belong inside the metric, whether a 30-day lag is necessary, whether the proxy is strong enough, or whether the metric supports a funding decision rather than only a learning decision. Those are better arguments.
Write one register before adding one chart
Do not start by redesigning the entire measurement system. Pick one metric the team already uses in a digital transformation review. Choose one that has political weight: digital share, self-service completion, automation rate, AI assisted resolution, online conversion, digital onboarding, or cost-to-serve reduction.
Write five fields on one page:
- Metric: the name used in reviews.
- Boundary: what counts and what is excluded.
- Proxy: what the metric stands in for and where it is weak.
- Lag: when the signal appears and when the outcome is knowable.
- Decision: the decision this metric can legitimately support.
Then bring that register to the next review before showing the chart. If people disagree with the boundary, you have found the real measurement work. If they accept the boundary, the chart becomes more useful because the claim is narrower and clearer.
Digital transformation does not need more decorative dashboards. It needs metrics whose boundaries are visible enough to be challenged. The boundary definition is not a footnote. It is the measurement product.