Article
AI adoption metrics need denominator maps
AI adoption is easy to overstate because the most convenient metric is usually the least useful one. A dashboard says that 42 percent of the company has adopted AI. A slide says that 300 people used a copilot last month. A transformation update says that ten teams are live. Each statement may be technically true, but none of them tells a leader what to do next.
The problem is not only the numerator. It is the denominator. Who could have used the tool but was never eligible? Who tried it once in a demo and never returned? Who uses it weekly for low-risk drafting but not inside a governed workflow? Who wanted to adopt it but was blocked by skills, data quality, privacy, legal uncertainty, cost, or ethics? Without those categories, an AI adoption metric rewards access and enthusiasm while hiding operational friction.
ISTAT gives a useful reality check. In its 2025 report on Italian enterprises and ICT, AI use among firms with at least 10 employees rose from 8.2 percent in 2024 to 16.4 percent in 2025, while large enterprises reached 53.1 percent and SMEs reached 15.7 percent. The same source reports that 83.6 percent of firms still use no AI technology, and that firms considering but not adopting AI cite blockers such as missing skills, legislative uncertainty, data quality, privacy, cost, and ethics. That is exactly why adoption should be measured as a map, not as one triumphant rate: ISTAT, Imprese e ICT 2025.
Adoption is not one numerator
A single adoption percentage mixes different states of reality. A product manager using an AI assistant to rewrite meeting notes, a finance analyst running governed extraction on invoices, and a sales rep who opened a chatbot once after a launch webinar can all appear in the same numerator. That makes the metric feel bigger, but it makes it less actionable.
The first repair is to treat adoption as a sequence of populations. Start with the total population that could plausibly benefit from the capability. Then separate eligibility from access. A team may be in scope for the business case but excluded because of data restrictions, region, role, system compatibility, or procurement timing. If you skip that distinction, the adoption rate punishes teams that were never allowed to participate and flatters programs that only targeted easy users.
This is the same discipline behind treating an operational dashboard as an internal product. The dashboard is not there to decorate a meeting. It should help someone make a decision about rollout, enablement, risk, investment, or deprecation. If the adoption metric does not say which decision it supports, it is probably a vanity number.
What belongs in a denominator map?
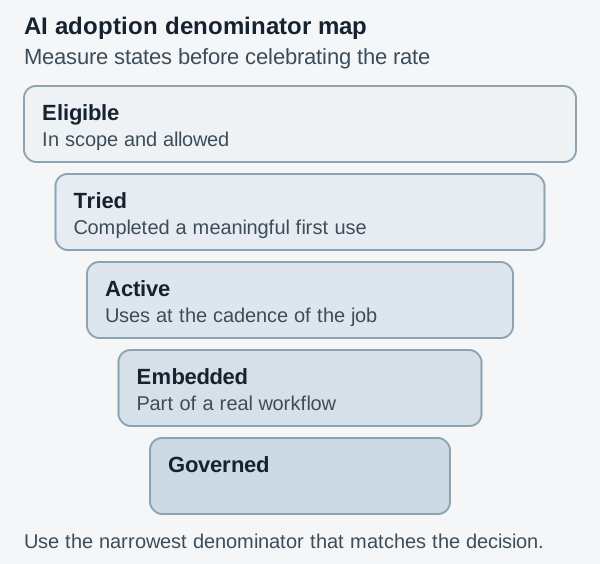
A denominator map breaks the adoption story into named states. The exact labels can change by company, but the minimum useful map contains seven groups.
First, define the eligible population. This is the set of users, teams, workflows, or business units for whom the AI capability is relevant and allowed. Eligibility should include scope rules, not vague ambition. “All employees” is rarely a serious denominator.
Second, count the tried population. These are people or teams that completed a meaningful first use, not people who received a license or attended a demo. A meaningful first use might mean completing a task, submitting a prompt with business data, running a workflow, or producing an output that someone reviewed.
Third, measure active use. Active use should be tied to a cadence that matches the work. Daily use is sensible for customer support triage. Monthly use may be normal for quarterly planning. The cadence must come from the job, not from a generic SaaS engagement habit.
Fourth, identify embedded workflow use. This is where adoption starts to matter. The AI capability is not just available beside the work, it is part of how the work moves. A governed document review flow, a monitored research assistant, or an approved extraction step belongs here. Casual use does not.
Fifth, separate blocked use. These are eligible groups that want or need the capability but cannot proceed because of missing skills, unavailable data, privacy constraints, unclear legal approval, integration gaps, cost, or ethical concerns. ISTAT’s blocker categories are a reminder that non-adoption is often information, not laziness.
Sixth, track abandoned use. Abandonment is not failure by default. It may reveal a weak use case, bad training, poor fit, excessive review burden, or a better non-AI alternative. If abandoned users disappear from the denominator, the program learns only from survivors.
Seventh, count governed production use. This is the narrowest and most valuable state. It means the workflow has owners, controls, review expectations, monitoring, fallback paths, and a clear business reason to exist.
Which denominator answers the decision?
The right denominator depends on the decision in front of you. If the question is “Should we buy more licenses?”, the denominator is not the whole company. It is the eligible population that is blocked only by access. If the question is “Should we invest in training?”, the denominator is the eligible and accessed population that tried once but did not become active. If the question is “Is the program reducing operational work?”, the denominator is the workflow population, not the user population.
This is where many adoption dashboards go wrong. They use one denominator for every conversation because consistency feels professional. But consistency is not the same as decision quality. A metric for rollout coverage, a metric for habit formation, and a metric for governed workflow adoption are different instruments.
The same warning applies when organizations claim to be measuring outcomes while still rewarding activity. If a team is really trying to understand change in work, it needs to avoid the trap described in measuring outcomes when the team still looks at hours. Counting AI sessions can become the new version of counting hours: visible, easy, and disconnected from whether the work improved.
Blockers are measurement categories, not excuses
A mature AI adoption review should not treat blockers as footnotes. Blockers are categories in the measurement model. They explain why the numerator is small, why the next investment should change, and why a broad adoption target may be unfair.
For example, a legal blocker and a skills blocker require different actions. Legal uncertainty may need a policy decision, risk classification, vendor review, or workflow redesign. A skills gap may need templates, coaching, examples, office hours, or role-specific playbooks. A data quality blocker may require upstream data work before any AI rollout is credible. A cost blocker may force prioritization by workflow value rather than by user enthusiasm.
This is why a good denominator map includes a “blocked but eligible” segment next to “active” and “governed.” It prevents leaders from saying, “People are not adopting,” when the more accurate sentence is, “People in this workflow cannot adopt until we solve approval, data, or capability constraints.” That difference matters because it changes the owner of the next action.
How to audit one AI adoption dashboard
Pick one AI adoption metric this week and rewrite it as a denominator map. Do not start with a new tool. Start with a table.
Write the current metric in plain language. Then write its numerator and denominator. If the denominator is “employees,” “users,” or “teams,” make it sharper. Which employees? Which users? Which teams? Eligible for what? Over what time period? For which workflow?
Next, add excluded populations. Some groups may be out of scope for good reasons. Name them so they are not silently counted as failures. Then add blocked populations. Give each blocker an owner and a decision. Training goes to enablement or team leadership. Privacy goes to legal, security, or data governance. Integration gaps go to product, platform, or IT. Weak use-case fit goes back to product discovery.
Finally, add a governed-use column. This is the column that prevents AI adoption from becoming demo theater. It asks whether the capability is embedded in a workflow that can be trusted, supported, monitored, and stopped when necessary. If that sounds close to the logic of measurement systems needing score receipts, it should. A metric is more credible when it carries the evidence of how it was produced.
The goal is not to make adoption look smaller. The goal is to make it legible. A denominator map lets leaders see whether they have an awareness problem, an access problem, a skill problem, a workflow problem, a governance problem, or no problem worth solving. That is the difference between celebrating AI adoption and managing it.